Validate Your Inputs with Agronomy 365
People. Products. Proof. These three pillars of BW Fusion lay the foundation for fundamentally changing the “standard” approach to crop nutrition.
The people are our team of farmer-focused expert agronomists, microbiologists, leaders and more, along with the growers we serve.
The products are our all-star lineup of biological crop nutrition blends, designed to support your crop from the inside out all season long
The proof is shown through Agronomy 365, which gives us full-picture views of how our products contribute to soil and plant nutrient levels.
Agronomy 365 provides the accurate, thorough data we need to validate product effectiveness, monitor the impact on crops and identify areas of improvement.
Take advantage of the knowledge and insights available with Agronomy 365 throughout the growing season. The soil and tissue sample analysis packages offered with the Agronomy 365 Dashboard empower you to make informed management decisions—purchasing and applying the products you need, and skipping the ones you don’t. No more wasting time on guesswork.
The new and improved Agronomy 365 Dashboard makes it easier than ever to view and understand the most important data from your fields, all in one place. Take a look:

See the weather forecast in your area, monitor nutrient levels across all of your fields, calculate nitrogen application decisions, review overall tissue ranking and more—all on the homepage of the 365 Dashboard.
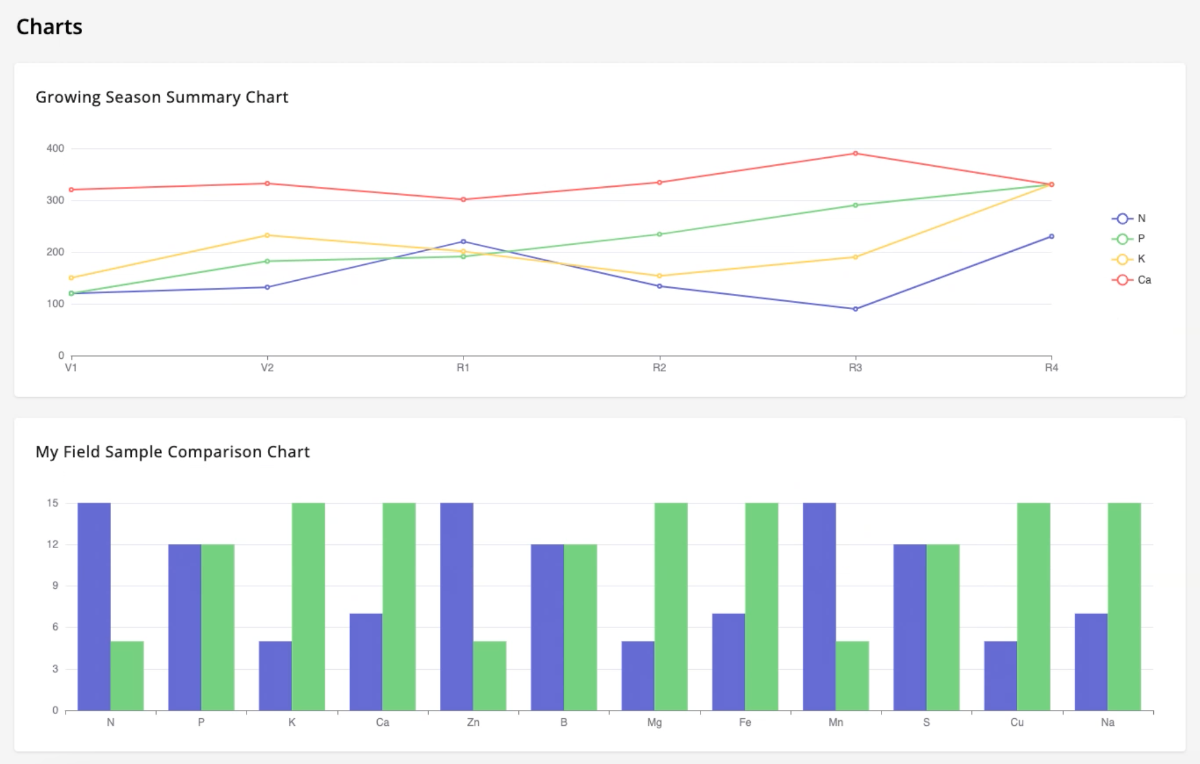
View nutrient level changes throughout the season and monitor progress with the Charts page, while tracking your data against other growers to see how your fields compare. Comparing your data against average and champion growers allows you to see if the nutrient you’re struggling with is a common issue for growers this season, or if your fields are excelling in a certain nutrient. If you’re an agronomist, you can even compare all of your growers’ data at once for insights into your team’s overall crop health.
The Growing Season Summary Chart provides an overview of nutrient levels across all of your fields, and the My Field Sample Comparison Chart provides a visual representation of the changes in nutrient levels between sample collections and analyses.
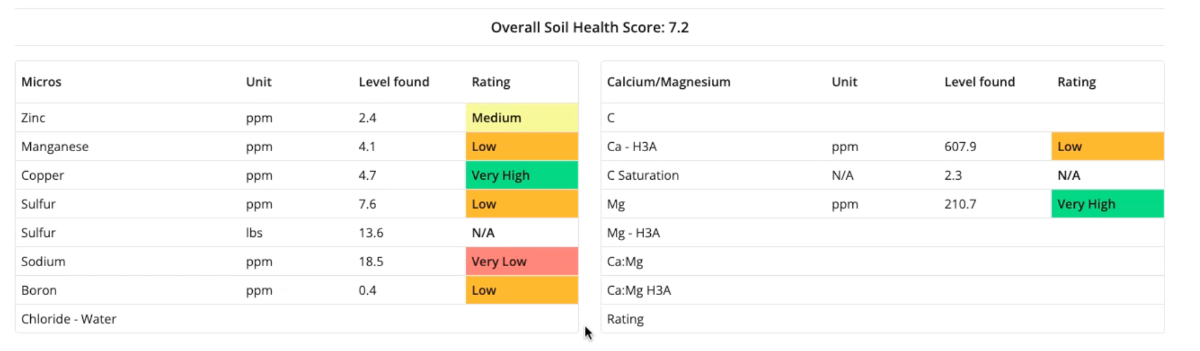
Generate soil and tissue sample analysis reports in seconds, and review complete breakdowns of your soil and tissue health, along with recommendations to optimize your nutrient levels.
Combining BW Fusion products with Agronomy 365’s industry-leading data analysis can have major impacts on the health of your soil and crops—and therefore, your farm’s profitability. Take control of your crop input decisions and explore the Agronomy 365 Dashboard today.
Read more: Putting Your Money Where It Counts—How Agronomy 365 Pairs with BW-Fusion